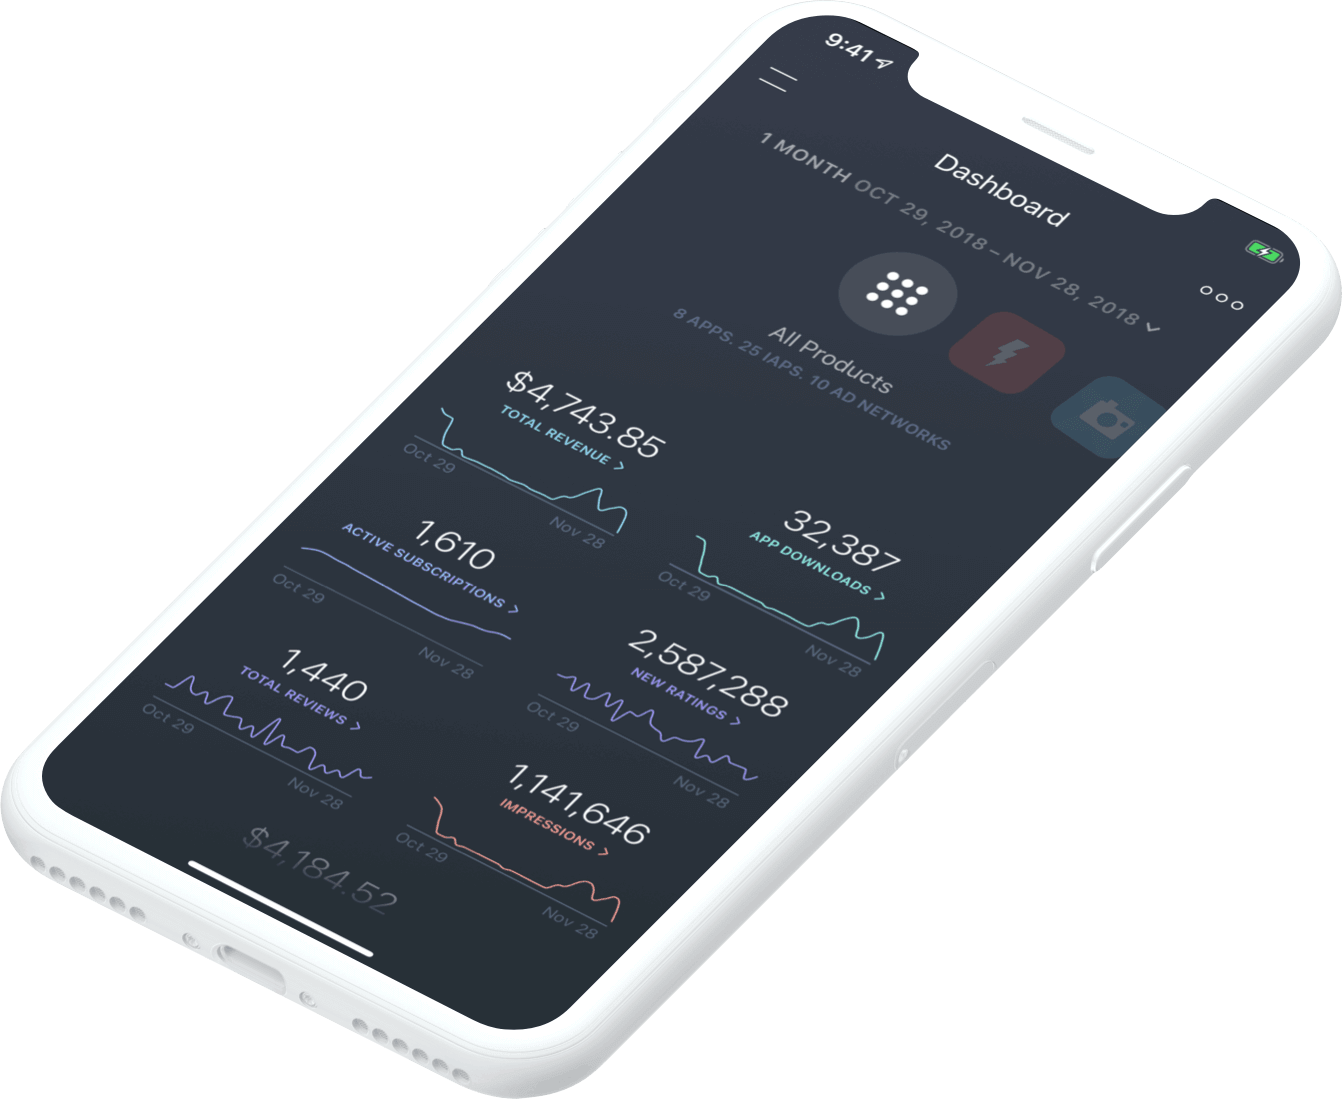
Your most important figures. On the go.
Appfigures Mobile puts the information you care about front-and-center. A clean dashboard presents the most important numbers at a glance, while individual reports are intelligently designed to let you drill-down and filter data as you go.
Revenue
View the total as well as detailed revenue from app sales, in-app purchases, and ad revenue.
Ad Spend
Get an overview of your ad statistics and dive into specific data sets like impressions, clicks and more.
Reviews
See your trends and read reviews from every app store, translated to the language of your choice.
Downloads
Track app and in-app downloads, updates, returns, educational downloads, and more.
Ratings
Monitor your ratings across stores and countries with daily trends.
Subscriptions
Keep tabs on active subscriptions, trials, MRR, churn, and more.
Flexible and powerful reports.
Every report provides additional breakdowns, which let you drill into your data with ease. Each data set can be broken down by a variety of options, including: date, product, country, store, and more. Any one of these can then be tapped for fine-grained filtering.
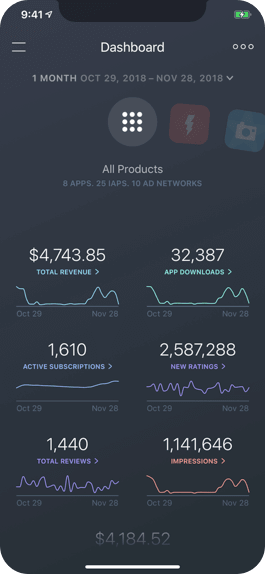
Get the full picture. Fast.
See important metrics about all of your apps in one intelligent dashboard. Browser individual apps with the swipe of a finger. View data from the past with just a couple of taps.
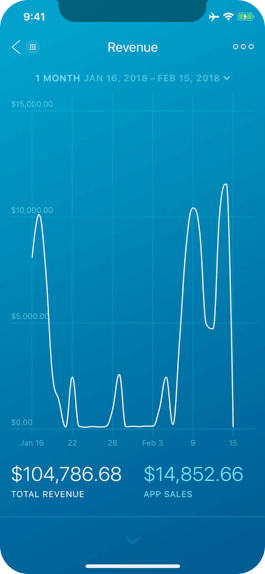
Explore rich, interactive reports.
Dig right into the metrics you care about with an interface that just gets out of your way. A simple, fluid interface makes exploring interesting data points a delightful task.
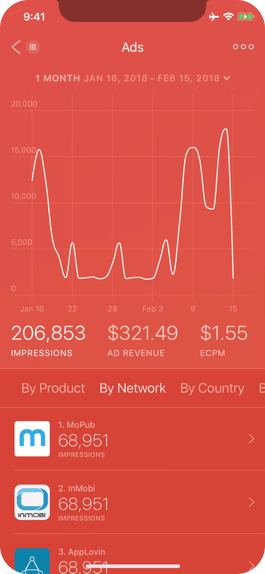
Break it down with a tap.
It couldn't be easier to slice and dice your numbers by product, country, store, and more. Let your curiosity guide you when you can explore your data at the speed of thought.
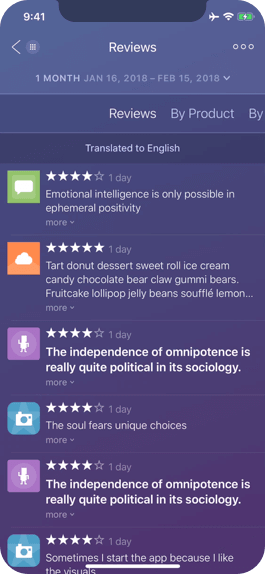
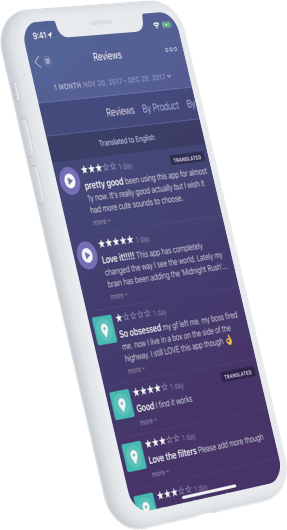
Every review, for every app, in your language.
Easily sort, translate, and share reviews from every one of your apps. We combine and normalize your reviews across every store and every country so you can simply focus on what your users have to say.
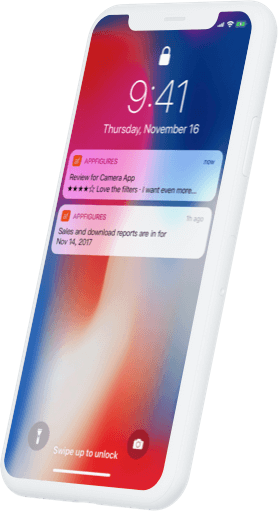
Never miss a beat with real-time alerts.
We'll let you know when there's a new review and when new reports are available. With our cutting-edge alerts platform behind the scenes, you'll always know what's going on without lifting a finger.
Only what you care about.
Custom filters let you specify exactly what you'd like to be notified about. Choose the type of reviews you'd like to track, the language you'd like to read them in, and how often you'd like to receive alerts.

Utility that Delights.
To ensure a smooth experience, we created custom UI components and a cutting-edge graphing API that’s both beautiful and smooth. This allows us to hand-craft each report to be informative, highly legible, and most importantly, a delight to use.
Hand-crafted graphs.
To truly deliver our vision we simply had to build our own libraries. You won't find graphs like these anywhere else.
Silky. Smooth.
No jitter. No lag. We spared no effort to ensure a great experience throughout.

